Tag: elasticsearch
-

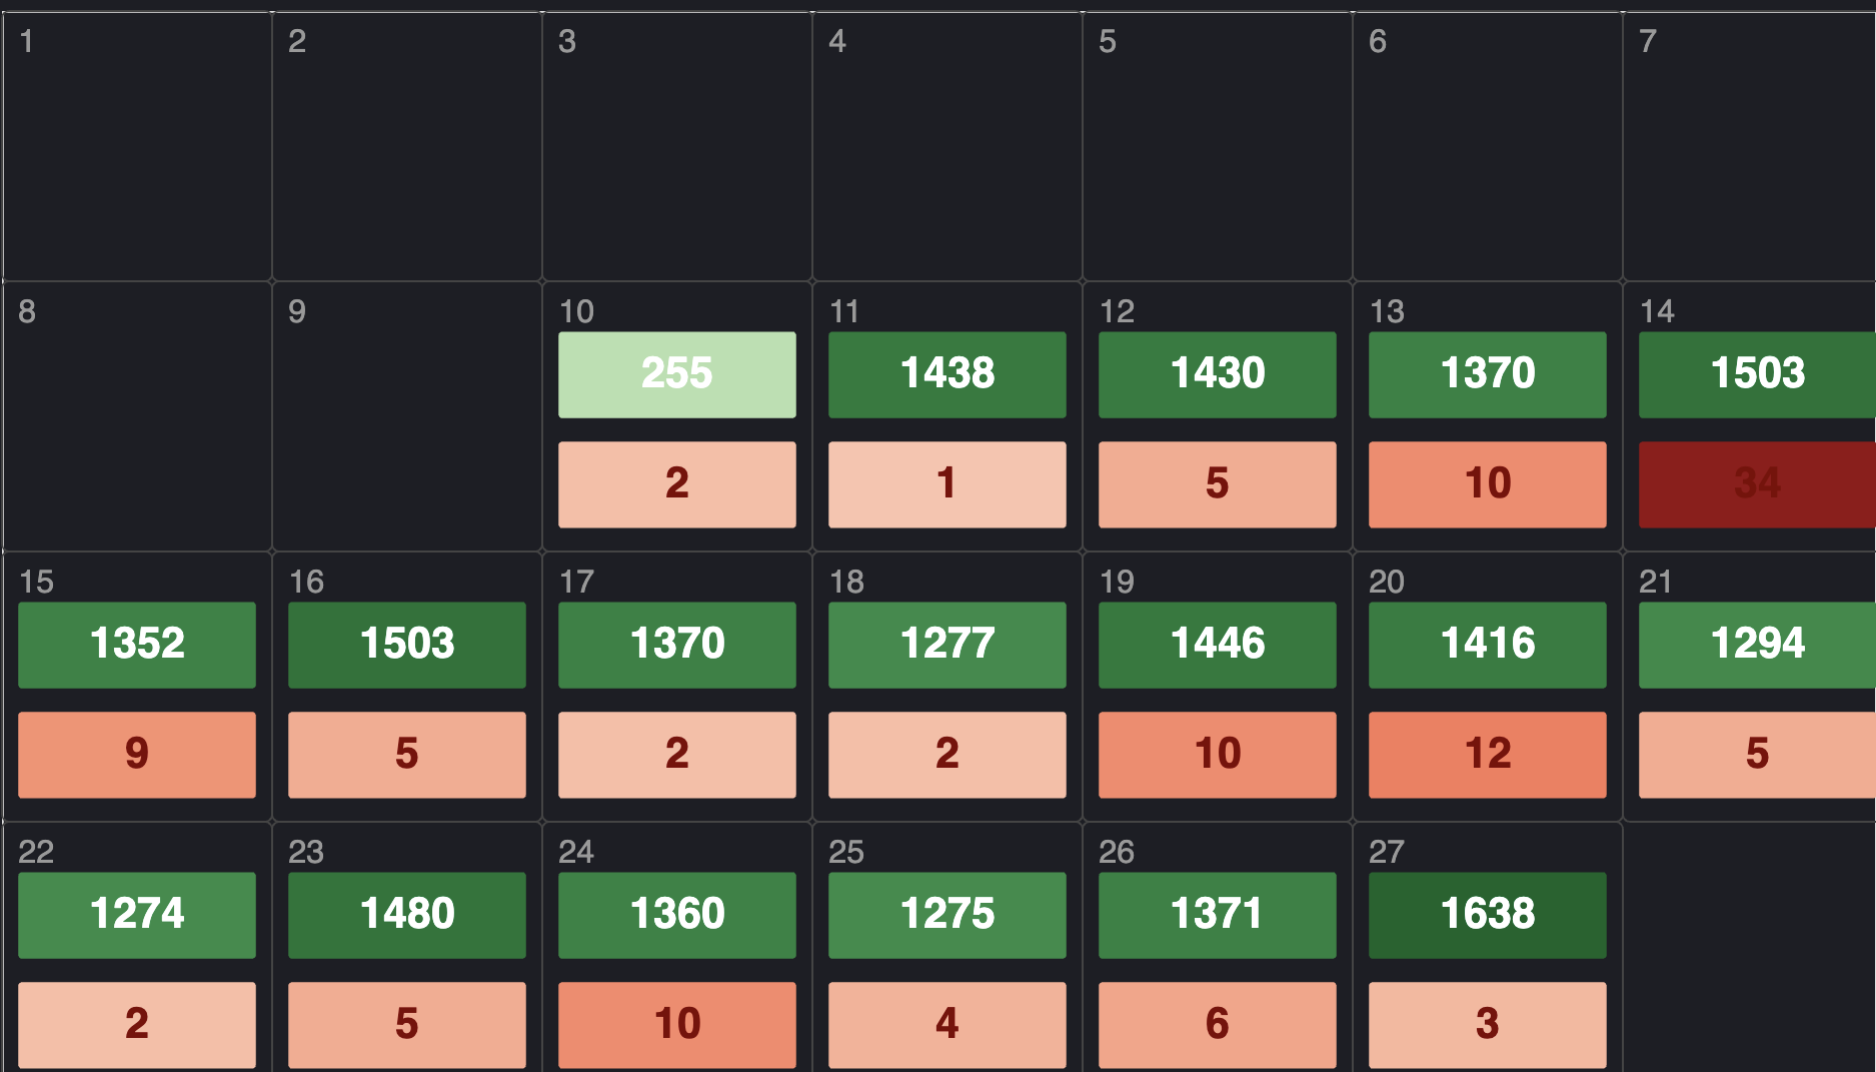
Customized Visualizations in Kibana (Calendar)
Although Elastic/Kibana offers it, I’ve never attempted the idea of custom visualizations, until recently. While sifting through my data, I had an idea to map Java Exceptions to days of the month. I thought it would be an interesting idea to see at a glance, what days we had more Exceptions than normal. Among other
-

ElastAlert2 To Process ELK Notifications
Yelp created a repository to aid in the processing of notifications via ELK logs. This repo went dormant, but another fork of it ElastAlert2 has replaced it. For me, this is personally an amazing application. I can get notifications, without having to buy into a commercial license. Setup Source: https://elastalert2.readthedocs.io/en/latest/running_elastalert.html#as-a-python-package It requires Python 3.11+ If
-

ELK: Creating a HTTP Status Code Graph
Having a graph showing HTTP Status codes over time is incredibly useful. A stacked bar graph can show an increase or decrease in one status code (such as 500 level), providing extreme usefulness at a glance. Consider the graph depicted at top of this article. We’re going to make that, but we’ll need access to
-

Elastic’s Pricing Problem
I really love Elastic and their product lineup. They have some amazing options and the fact you can get started for FREE is a very strong plus. As a SIEM, the ELK stack (Elastic, Logstash, Kibana) is snappy, responsive, and consistent. Once I setup the index rotation I never have a problem with stability. But
-

Monitor Third Party Front-End Libraries
It’s always useful to keep track of what JS or CSS libraries are being pulled into the Front-End by hosted 3rd parties. Examples could be CDN’s. While there are services that charge for this monitoring, this can be accomplished with an Open Source stack. The Goal A web server’s access logs will make mention of
-

Creating a High Severity Suricata Dashboard in ELK
Once you have your ElasticSearch server running with Kibana, and it’s being fed data from Suricata installs via Filebeat, you can view the data coming in through some default dashboards. Filebeat has two suricata default dashboards, one for alerts and one for events. I like the default Filebeat Suricata dashboards, except that the Alert one
-
![Suricata + ELK [Installation]](https://ffe4.org/wp-content/uploads/2023/01/suricata.png)
Suricata + ELK [Installation]
Technically, this install should be described as: Suricata / Filebeat + ElasticSearch/Kibana but it makes for a poor headline. Architecture In a multi-suricata server environment, the ElasticSearch Server is paired with the Kibana GUI. Individual Suricata installs are setup with Filebeat agents on separate points in the network(s). Filebeat sends each Suricata machine’s log data
Recent Posts
- Customized Visualizations in Kibana (Calendar)

- Wazuh: When things go wrong
- CSRF Exploitation
- ZAP and it’s terrifying problems
- Getting Data on Usernames
Tags
App Archive.org CSRF dashboard EDR elasticsearch elk email Exercise EXIF filebeat GHunt Google Earth gvm IDS kibana logic Maltego OpenCTI openvas OSINT owasp philosophy Reporting Reverse Image Search scanner suricata Wazuh ZAP