Tag: dashboard
-

Creating a High Severity Suricata Dashboard in ELK
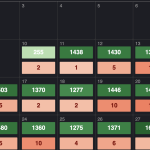
Once you have your ElasticSearch server running with Kibana, and it’s being fed data from Suricata installs via Filebeat, you can view the data coming in through some default dashboards. Filebeat has two suricata default dashboards, one for alerts and one for events. I like the default Filebeat Suricata dashboards, except that the Alert one
Recent Posts
- Customized Visualizations in Kibana (Calendar)

- Wazuh: When things go wrong
- CSRF Exploitation
- ZAP and it’s terrifying problems
- Getting Data on Usernames
Tags
App Archive.org CSRF dashboard EDR elasticsearch elk email Exercise EXIF filebeat GHunt Google Earth gvm IDS kibana logic Maltego OpenCTI openvas OSINT owasp philosophy Reporting Reverse Image Search scanner suricata Wazuh ZAP
Comments
No comments to show.