Tag: kibana
-
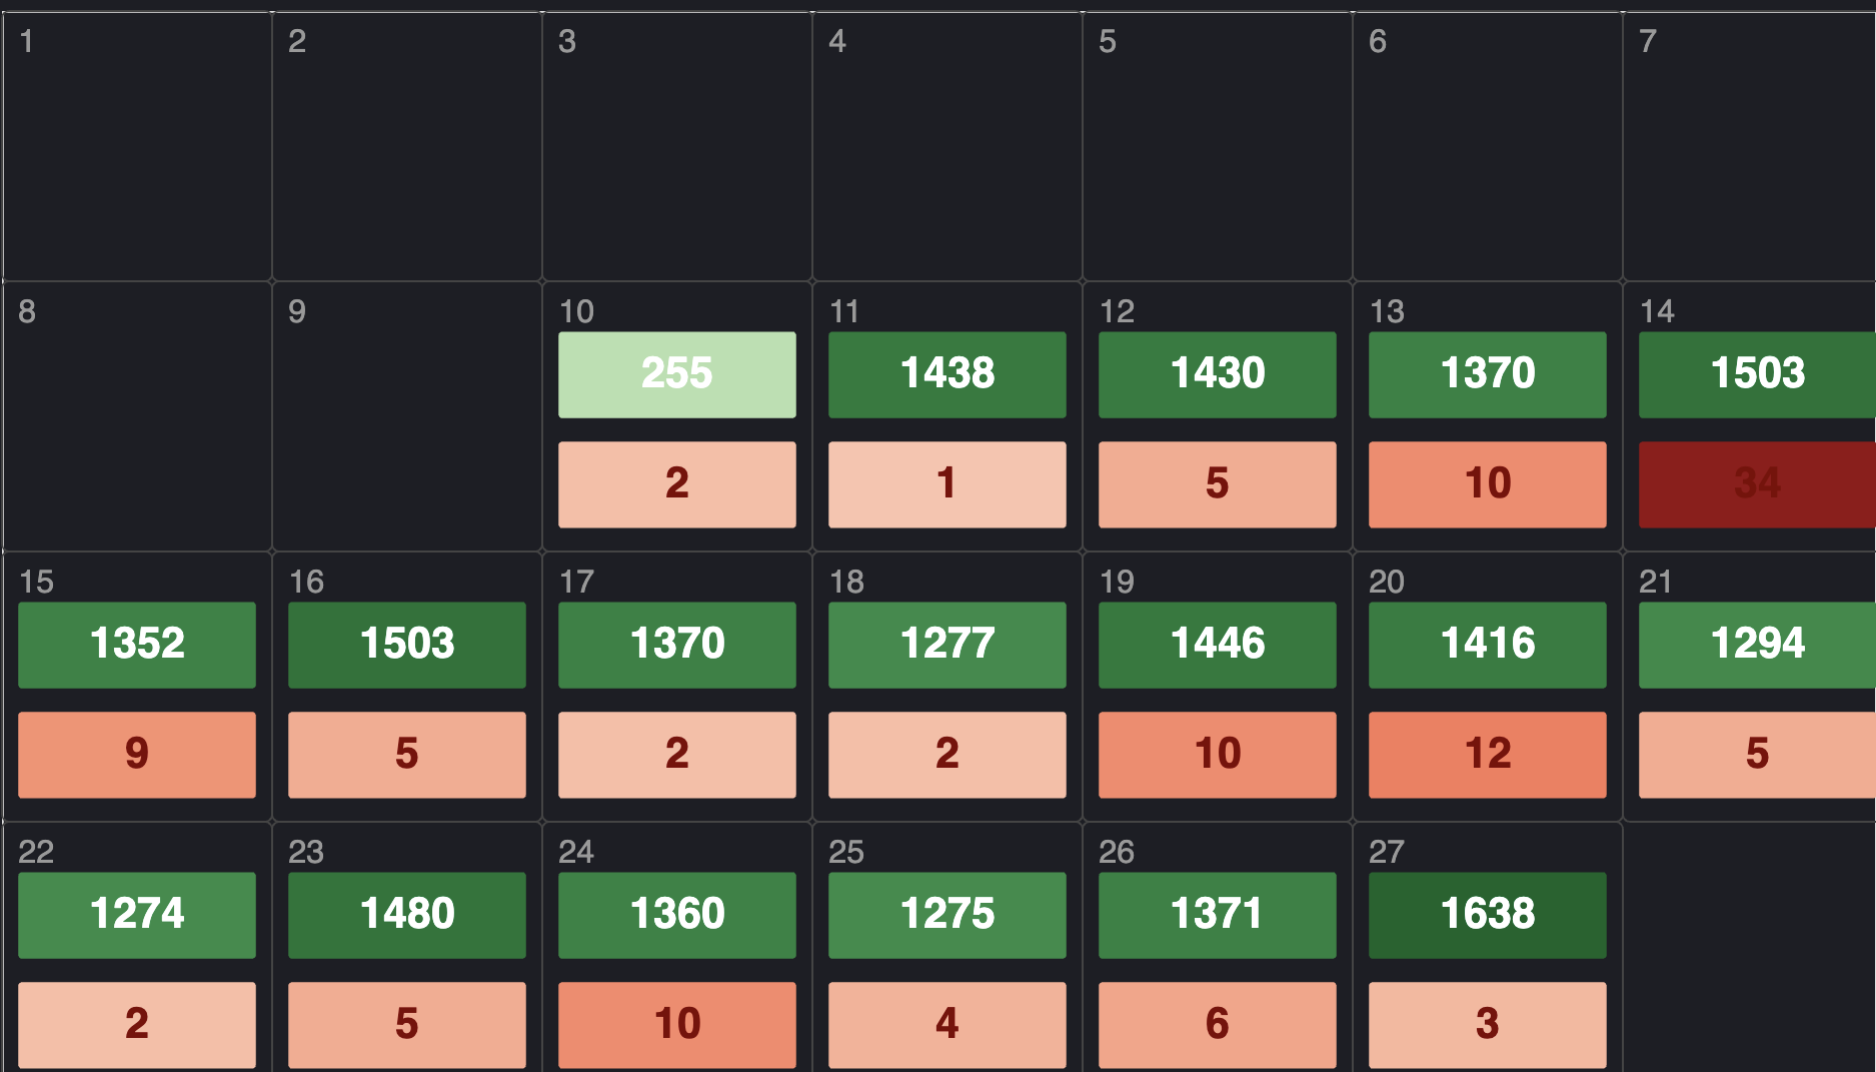
Customized Visualizations in Kibana (Calendar)
Although Elastic/Kibana offers it, I’ve never attempted the idea of custom visualizations, until recently. While sifting through my data, I had an idea to map Java Exceptions to days of the month. I thought it would be an interesting idea to see at a glance, what days we had more Exceptions than normal. Among other
-

ELK: Creating a HTTP Status Code Graph
Having a graph showing HTTP Status codes over time is incredibly useful. A stacked bar graph can show an increase or decrease in one status code (such as 500 level), providing extreme usefulness at a glance. Consider the graph depicted at top of this article. We’re going to make that, but we’ll need access to
-
ELK Migration Woes: PUT values without Kibana
I’ve been upgrading my home ELK stack from from 7.17.* to 8.7.*. In the process I got to a state where elasticsearch was running, filebeat was running, but Kibana was failing. Doing a systemctl status kibana reported something about : cluster.routing.allocation.enable needing to be set to 'All' Looking this up, got me to this ElasticSearch
-

Monitor Third Party Front-End Libraries
It’s always useful to keep track of what JS or CSS libraries are being pulled into the Front-End by hosted 3rd parties. Examples could be CDN’s. While there are services that charge for this monitoring, this can be accomplished with an Open Source stack. The Goal A web server’s access logs will make mention of
-

Filebeat Custom Field Processing for ELK
I had a recent project at work, where I needed to parse a load balancer log. The interesting part of the project was to capture data that was being added to the log. This short post will cover what I did to capture the data and render it in Kibana / ELK. If you have
-

Timeline Dashboard in Kibana for IDS
The Dashboard discussed in this project is created with Kibana and is suitable for an IDS feed like Suricata using Filebeat or Logstash. For more information on setting up Suricata as an IDS with ELK (ElasticSearch, Kibana, Logstash, Filebeat), see MY OTHER ARTICLE [LINK]. Dashboard Goal In this article I want to do a quick
-

Creating a High Severity Suricata Dashboard in ELK
Once you have your ElasticSearch server running with Kibana, and it’s being fed data from Suricata installs via Filebeat, you can view the data coming in through some default dashboards. Filebeat has two suricata default dashboards, one for alerts and one for events. I like the default Filebeat Suricata dashboards, except that the Alert one
-
![Suricata + ELK [Installation]](https://ffe4.org/wp-content/uploads/2023/01/suricata.png)
Suricata + ELK [Installation]
Technically, this install should be described as: Suricata / Filebeat + ElasticSearch/Kibana but it makes for a poor headline. Architecture In a multi-suricata server environment, the ElasticSearch Server is paired with the Kibana GUI. Individual Suricata installs are setup with Filebeat agents on separate points in the network(s). Filebeat sends each Suricata machine’s log data
Recent Posts
- Customized Visualizations in Kibana (Calendar)
- Wazuh: When things go wrong
- CSRF Exploitation
- ZAP and it’s terrifying problems
- Getting Data on Usernames
Tags
App Archive.org CSRF dashboard EDR elasticsearch elk email Exercise EXIF filebeat GHunt Google Earth gvm IDS kibana logic Maltego OpenCTI openvas OSINT owasp philosophy Reporting Reverse Image Search scanner suricata Wazuh ZAP