It’s always useful to keep track of what JS or CSS libraries are being pulled into the Front-End by hosted 3rd parties. Examples could be CDN’s. While there are services that charge for this monitoring, this can be accomplished with an Open Source stack.
The Goal
A web server’s access logs will make mention of each GET request. This allows a view into the CDN or external libraries being called. The domain may or may not be listed. If it’s listed, even better, if not, then we need to parse the output so that all JS files mentioning a CDN source are filtered out.
This could be accomplished using a scripting language like Python, or a more performant language like Rust. It can also be handled via a log parsing system, such as ELK.
Python Ad-Hoc Solution
For an ad-hoc solution a python script makes sense. Below I used Chryswoods.com‘s regex solution to parsing a file. This could be modified to look for cdn lines ending in [.js|.css] etc.
#Python Script derived from: https://chryswoods.com/intermediate_python/regexp.html

import re

lines = open("access.log", "r").readlines()
for line in lines:
    if re.search(r"cdn", line):
        print(line, end="")
Real Time Monitoring with ELK
A better solution is to add third party library detection to a real-time dashboard. This way the changes are spotted without having to remember to run an ad-hoc run of a script. For this task I’ll be using ELK, therefore a prerequisite for this would be the installation of ELK.
I have a guide on installing ELK [link], skip to the ELK section and ignore all references to Suricata since that is not required. Filebeat will need to be installed. The basics can be found in the same linked file above, keep in mind that Filebeat will need a module enabled.
SETUP
Adding the Webserver that is managing the access log to Filebeat is handled through the module install:
sudo filebeat modules enable [name of your webserver]

# Edit the modules YML file. For example, if NGINX is the Web Server:
sudo nano /etc/filebeat/modules.d/nginx.yml

# In the [webserver].yml file (i.e. nginx) modifications will need to be made
# Paths to the log files will need to be uncommented, like in the NGINX example below:

- module: nginx
  # Access logs
  access:
    enabled: true

    # Set custom paths for the log files. If left empty,
    # Filebeat will choose the paths depending on your OS.
    var.paths:
       - /var/log/nginx/access.log

  # Error logs
  error:
    enabled: true

    # Set custom paths for the log files. If left empty,
    # Filebeat will choose the paths depending on your OS.
    var.paths:
       - /var/log/nginx/error.log

# SAVE and CLOSE the YML file

# Next, run setup -e to validate the updated YML files:

sudo filebeat setup -e
# if no errors on setup, run:

sudo systemctl restart filebeat
Validating the Filebeat / ELK connection can be handled through ELK’s Discover section.
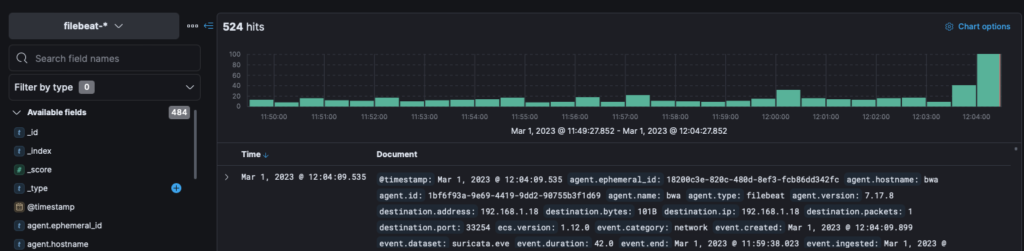
Logging into ELK as the Elastic user (setup during the install instructions linked to earlier on), click the left-side hamburger menu. Then scroll down to Discover. On the Discover page review the data events flowing in. They will appear like so:
ELK TO FILTER FOR 3RD PARTY LIBRARIES
With the prerequisites met (ELK and Filebeat installed) the access log can be managed and parsed for third party libraries. It is worth noting that Filebeat will likely install default dashboards for the Webserver that was enabled in the setup phase. If it was NGINX, entering “nginx” in the top search field will return a Filebeat [NGINX] Dashboard. That will have some significant and useful data.
Create a NEW VISUALIZATION (either edit a dashboard, or create a new dashboard and then click “Create Visualization”).
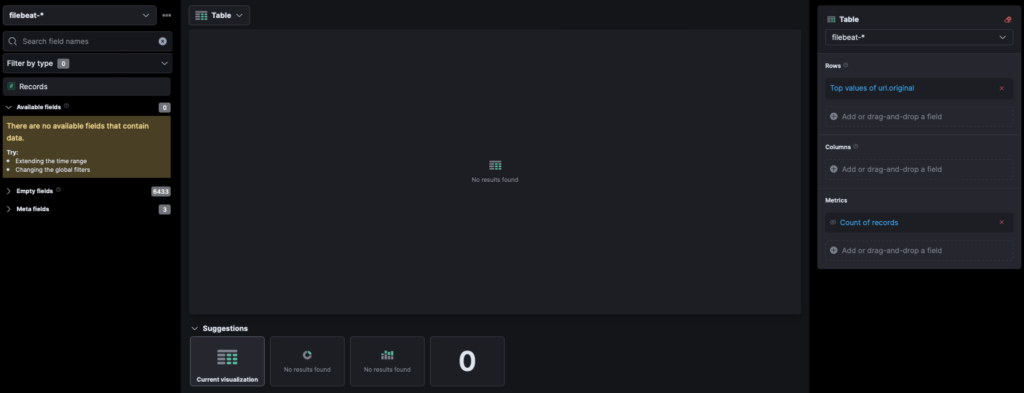
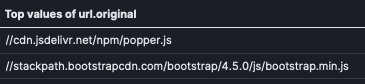
On the left side of the screen (pictured above), type url.original, in the “Search field names” field. When it appears, drag the field to the center section, and change the graph type to Table (as pictured above).
Once done, all the values found in url.original will populate the table.

At the top of the screen is an “add filter” link. Once clicked it will open a sub menu with several fields. In the top right corner of the sub-menu is a link for “Edit Query as DSL“, click that link.
This will open a text field populated by an empty {}.
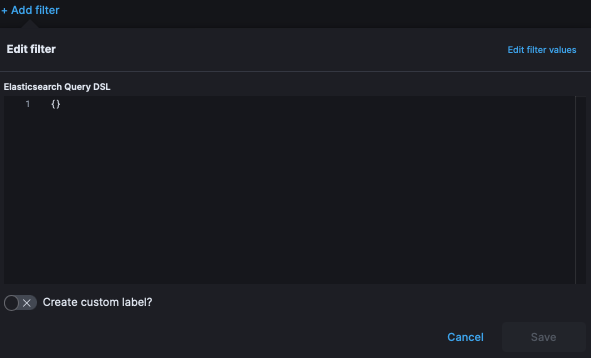
Enter the code below (or whatever variation that fits your specific requirement):
{
  "query": {
    "wildcard": {
      "url.original": "*cdn*js"
    }
  }
}
ELK is now parsing the url.original values for the wildcard cdn that ends with js. This can of course be modified to *cdn*css or left as *cdn*.
Note: The official documentation on wildcard arguments suggest to not preface a parameter with a wildcard for performance reasons. However, in my use cases I’ve not had performance issues, but consider it for your own use cases.
Why not wildcard for *cdn*?
Many automated scans will make use of cdn as a search criteria. This causes data anomalies that will need to be further filtered out.
How to use multiple wildcards?
Multiple queries can be handled using Query DSL like:
{
  "query": {
    "bool": {
      "should": [
        {
          "match_phrase": {
            "url.original": "*cdn*js"
          }
        },
        {
          "match_phrase": {
            "url.original": "*cdn*css"
          }
        }
      ],
      "minimum_should_match": 1
    }
  }
}
End Result
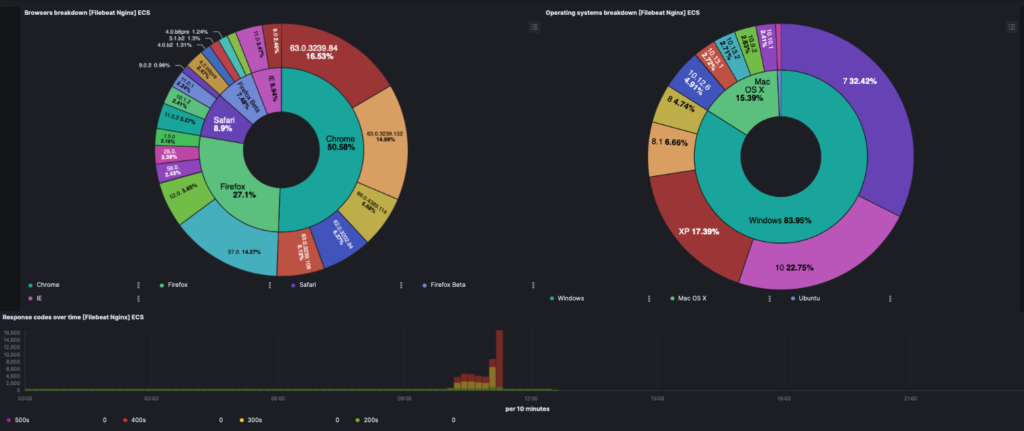
Once added to a Dashboard, ELK will provide real time data of who is hitting the site, what is being accessed, by what browser / os, and what third party libraries are being utilized.
The table above doesn’t do a Dashboard justice. ELK’s dashboard capabilities are very beautiful and elegant. One example of NGINX logs I use in my personal usage, show breakdowns by browser and OS in a stunning visual, like so: