
Having a graph showing HTTP Status codes over time is incredibly useful. A stacked bar graph can show an increase or decrease in one status code (such as 500 level), providing extreme usefulness at a glance.
Consider the graph depicted at top of this article. We’re going to make that, but we’ll need access to a field like http.response.status_code. That field, for me, is from a proxy. If you lack a proxy but have a web server (NGINX, Tomcat, Apache, etc.) you likely have a similar status code. The field needs to provide data on status code response: 200, 301, 404, 502, etc.
Creating the Visualization
Open a Dashboard, and edit it so that the “Create new Visualization” button is available.
On the left side, make sure you have the right Source listed (likely Filebeat-*). Under the source, there’s an input field for “Search field names.” In that field type: status
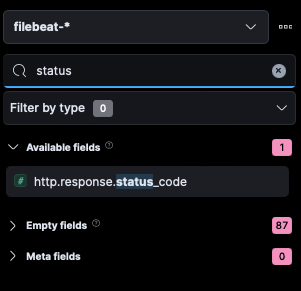
For me, this field is called http.response.status_code.
If you have multiple status code type fields, clicking on each one in the left side nav will popup sample data like so:
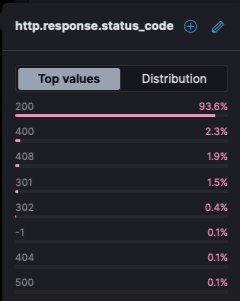
A field that has data like the above screenshot will work.
Click that field and drag it to the blank center area (where it says “Drag some fields here to start”).
Initially the data isn’t very useful! Look at that, everything is the same! That’s because of our settings on the right.
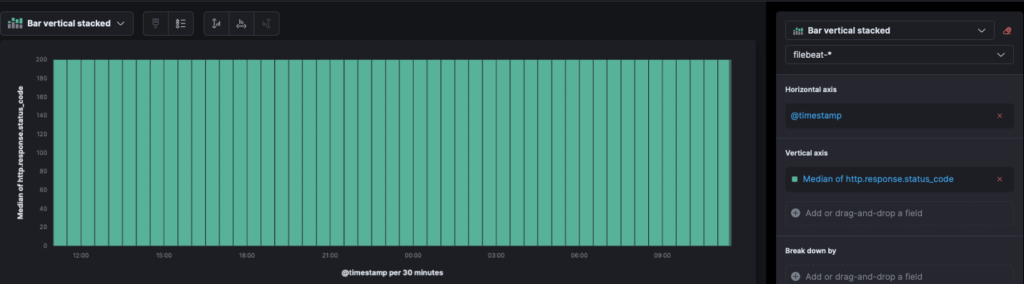
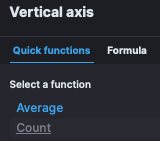
On the right it auto set the Vertical Axis to be Median of my field. So it grabbed value 200 and set every instance at that (since that’s the most common value in a given time event).
To fix this, we need to change the Vertical Axis to “Count.” Click “Median of http.response.status_code” and then chose “Count”:
Now we get variation of http.response.status_code over time. But we’re not seeing the variation of all the different codes… to do that, we need to set another setting. Close the Vertical Axis sub window so we’re back to the main settings for the graph.
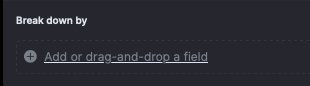
Look for the setting “Break Down By” and click the link “Add or drag-and-drop a field”.
In the Break Down By window, click in the search field and type: status
Pick the same field you used in the initial steps (for me it’s http.response.status_code).
All the status codes are now present, and displayed as they occurred over time.
Before we leave this screen, let’s change the color palette. Click “Color palette” and in the sub menu choose Status Color Palette:
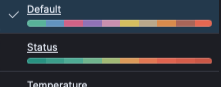
This will automatically set 200’s to green and 400 to yellow to orange and 500’s to red.