Although Elastic/Kibana offers it, I’ve never attempted the idea of custom visualizations, until recently. While sifting through my data, I had an idea to map Java Exceptions to days of the month. I thought it would be an interesting idea to see at a glance, what days we had more Exceptions than normal. Among other things, this could be useful in determining if, after a release, the exception count goes up or down.
Custom Visualization
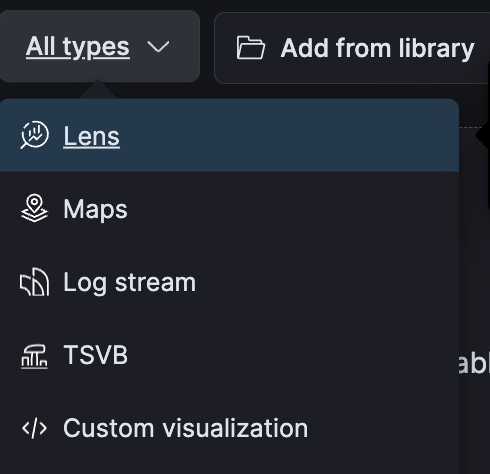
Kibana has an option for custom visualizations. It’s pretty easy to find in Kibana 7 and a bit buried in Kibana 9. In Kibana 7, when editing a dashboard, clicking the visualization dropdown, there’s an option (under “All Types”) for “Custom Visualization.”
In Kibana 9, this option is under the Burger Menu > Analytics > Visualize Library.
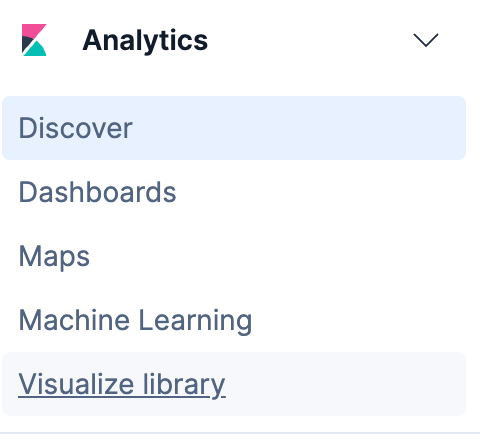
From the Visualize Library page, click Create Visualization.

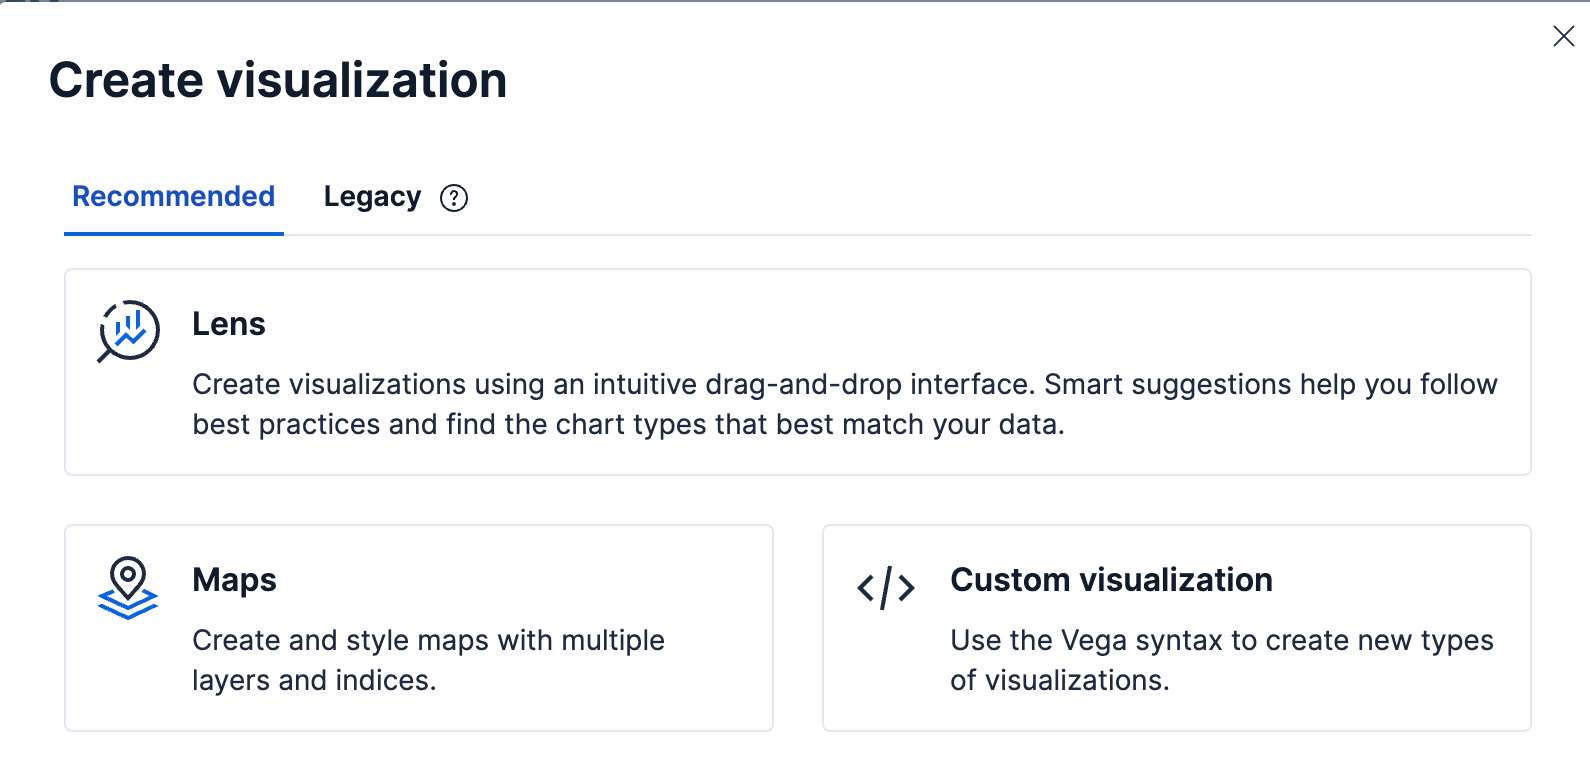
This will load the Kibana 9 modal where “Custom Visualization” can be clicked:
Once loaded the Custom Visualization screen will look the same in Kibana 7 and 9.

On the left is the visualization page. On the right is the code. The code is in a schema called “Vega” which follows JSON structure.
Calendar Visualization
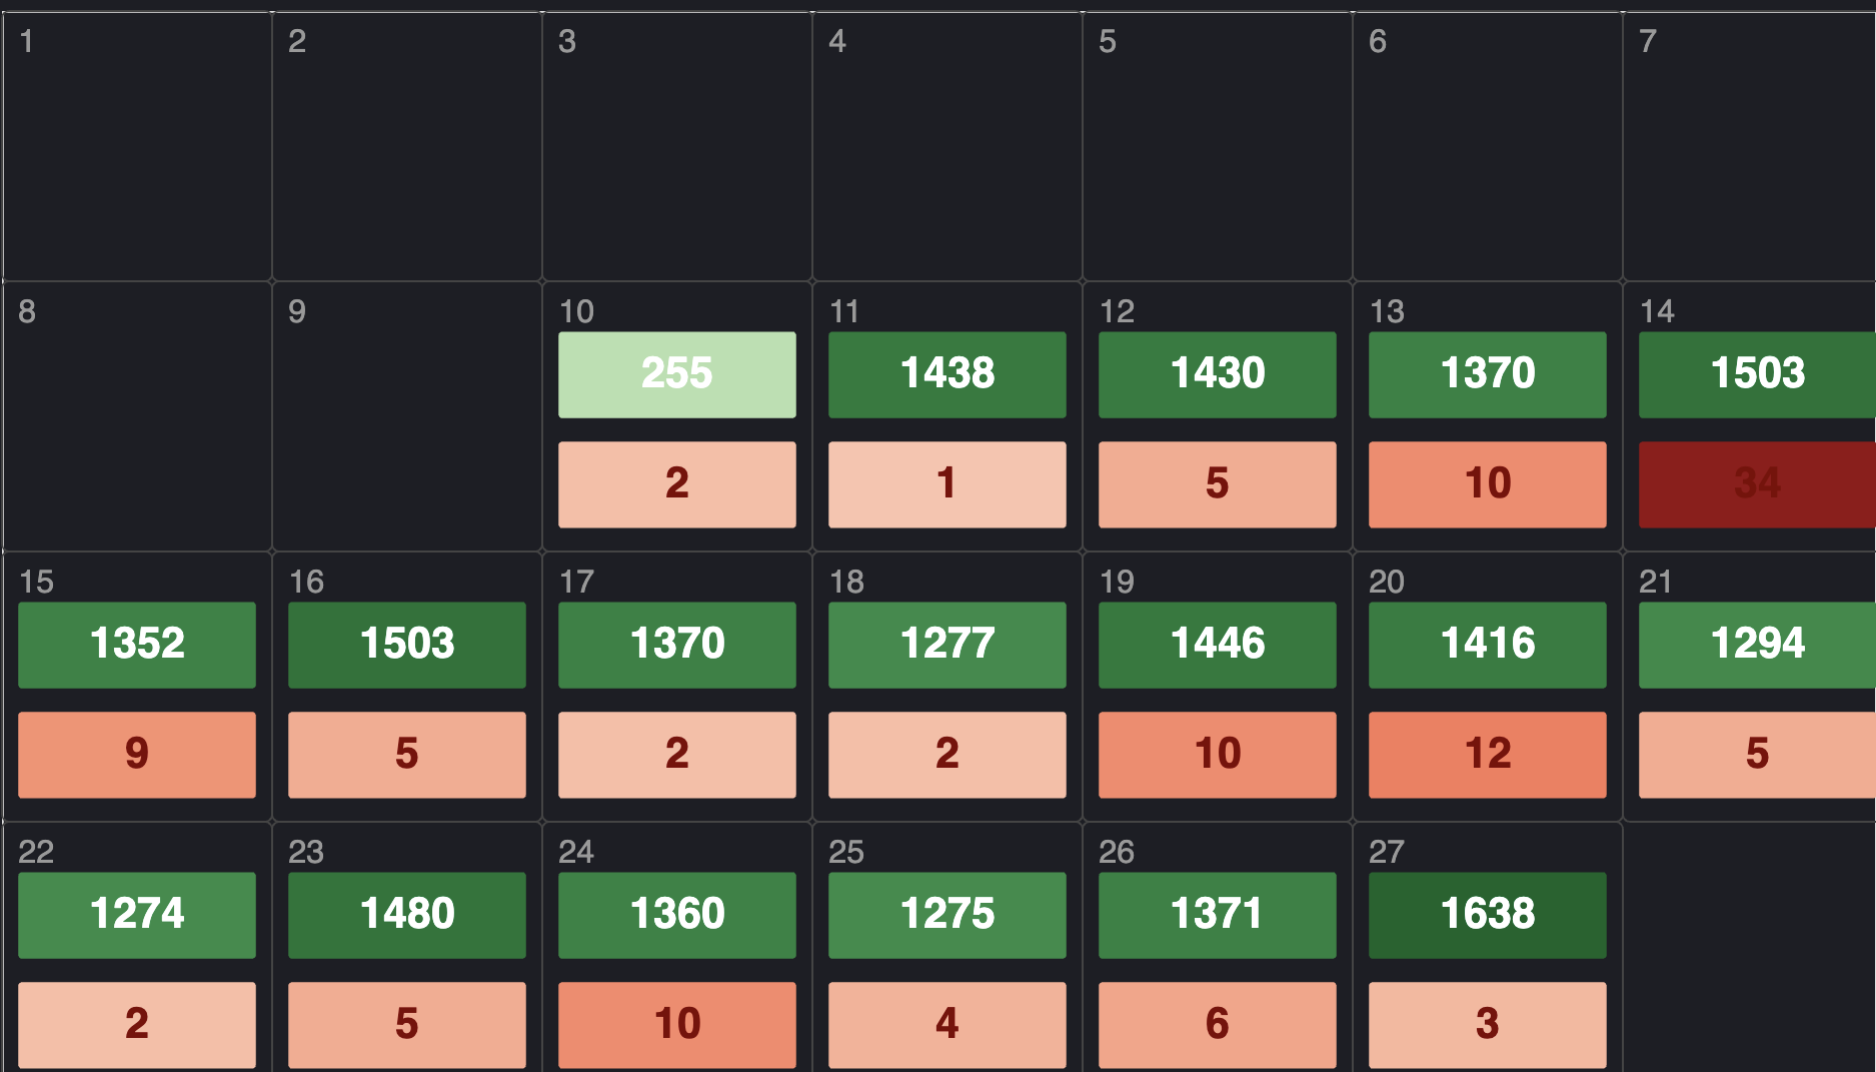
I wanted to make a calendar that showed the days of the month, with data aggregate counts on each day. The counts would be based on specific queries. Below is an example of a calendar that shows dummy data that aggregate counts of Signups for an application in green and cancelations in red:

It also has a heatmap effect, the darker the color the greater the count.
Gemini’s Assistance
Generating a calendar like this, with an aggregate count by day, in a calendar, with a heat map applied… it’s no small feat. I worked with Gemini, over the space of an hour or so to get it working.
For those interested here are the prompts used:
I started with a general concept idea: is this doable?
using elastic vega to create a custom dashboard, can we create a calendar with the count of events in the cell for each day of the month?
It answered that it is doable and it provided an initial set of JSON
{
  "$schema": "https://vega.github.io/schema/vega-lite/v5.json",
  "title": "Daily Event Count Calendar",
  "data": {
    "url": {
      "%context%": true,
      "%timefield%": "@timestamp",
      "index": "your-index-name",
      "body": {
        "aggs": {
          "by_day": {
            "date_histogram": {
              "field": "@timestamp",
              "calendar_interval": "1d",
              "min_doc_count": 0
            }
          }
        },
        "size": 0
      }
    },
    "format": {"property": "aggregations.by_day.buckets"}
  },
  "transform": [
    {"calculate": "toDate(datum.key)", "as": "date"},
    {"calculate": "day(datum.date)", "as": "day_of_week"},
    {"calculate": "week(datum.date)", "as": "week_of_year"},
    {"calculate": "date(datum.date)", "as": "day_of_month"}
  ],
  "encoding": {
    "x": {
      "field": "day_of_week",
      "type": "ordinal",
      "title": null,
      "axis": {
        "labelExpr": "['Sun', 'Mon', 'Tue', 'Wed', 'Thu', 'Fri', 'Sat'][datum.value]",
        "labelAngle": 0,
        "orient": "top"
      }
    },
    "y": {
      "field": "week_of_year",
      "type": "ordinal",
      "title": null,
      "axis": null,
      "sort": "descending"
    }
  },
  "layer": [
    {
      "mark": {"type": "rect", "stroke": "white", "strokeWidth": 2, "cornerRadius": 4},
      "encoding": {
        "color": {
          "field": "doc_count",
          "type": "quantitative",
          "scale": {"scheme": "blues"},
          "legend": {"title": "Events"}
        },
        "tooltip": [
          {"field": "date", "type": "temporal", "timeUnit": "yearmonthdate", "title": "Date"},
          {"field": "doc_count", "type": "quantitative", "title": "Count"}
        ]
      }
    },
    {
      "mark": {"type": "text", "align": "left", "baseline": "top", "dx": -18, "dy": -18, "fontSize": 10, "color": "#555"},
      "encoding": {
        "text": {"field": "day_of_month", "type": "nominal"}
      }
    },
    {
      "mark": {"type": "text", "align": "center", "baseline": "middle", "fontSize": 14, "fontWeight": "bold"},
      "encoding": {
        "text": {"field": "doc_count", "type": "quantitative"},
        "color": {
          "condition": {"test": "datum.doc_count > (100)", "value": "white"},
          "value": "black"
        }
      }
    }
  ],
  "config": {
    "view": {"step": 45, "stroke": "transparent"},
    "axis": {"domain": false, "ticks": false}
  }
}
Above is a very generic approach. This was fine tuned with specific fields and queries and modifying the look and feel of the Calendar.

Use of Gemini
I feel I need to mention that the use of Gemini had no hallucinations. It did as instructed. Over the space of an hour or two it was flushed out as requirements changed and bugs that were found, where eradicated.
This use of Gemini did not use Antigravity. I used Gemini 3 Pro in browser.