I had a recent project at work, where I needed to parse a load balancer log. The interesting part of the project was to capture data that was being added to the log. This short post will cover what I did to capture the data and render it in Kibana / ELK.
If you have a log (tomcat, nginx, haproxy) and your IT/dev team is adding modified fields to it, you can still capture those fields even though they are outside the scope of the Filebeat Module. A Filebeat module is an add on that installs a pipeline for the module into the ELK server.
Installing a Module
For example, if you were wanting to monitor Tomcat’s Catalina log, simply installing the Filebeat Tomcat module will automatically setup a pipeline from your server back to ELK. You can install a module with this syntax:
sudo filebeat enable [module name]
sudo filebeat setup -e
sudo systemctl restart filebeat
Custom Processing
What if your team has modified the default logs to include special fields. These fields might be class or method names invoking an error, or it could be a field listing a banned IP hitting an endpoint. Default modules won’t pick that data up, as it’s not part of the standard pipeline.
You can however add this data through tokenization. Tokenization is a section of the Processor element of a yaml file.
Filebeat has a processor element, and within it a tokenizer [Resource Link on Tokenizer]. As seen in the documentation, the default tokenizer is a whitespace tokenizer. This means that if create a tokenizer on log output, each term in the log output, separated by space, would be it’s own token:
# Example log: Feb 22 2023 09:29:00 - - WARN - Class:HTMLUtility::failed to load resource
processors:
  - dissect:
      tokenizer: '%{month} %{day} %{year} %{time} %{-} %{-} %{log_level} %{-} %{error_class}
      field: "message"
In the above example, we would get a message field inside Kibana, as well as the dissect variable. We would have values such as dissect.month (Feb), dissect.day (22), dissect.year (2023), dissect.time (09:29:00) and so on. If you wanted to plot the values for log levels, you could create a visualization based on dissect.log_levels. Each of the %{} has a variable name which is referenced through the “dissect” method.
In the above example we may have a problem when we attempt to get data on %{error_class}, as the white space separating parts of the error would be lost. However, if you’re digging out a value within some space delimited output, the standard tokenizer should work well enough.
Setting Up Tokenization in Filebeat
If you’re using Filebeat the way you setup processing and tokenization is to make some edits in your YML file. Be careful to use only one yml file to load your log. If filebeat.yml is referencing a log, and your module (i.e. tomcat.yml) is also referencing the same log, then you’ll soon get an error: Error creating runner from config: failed to create input: Can only start an input when all related states are finish. This error indicates that two inputs are sourcing the same log file, which creates a collision. You may get away this in a test environment, but once you are in a production environment with heavy data consumption, this will be an issue.
Module YML
If you are using a module (haproxy.yml, nginx.yml, tomcat.yml, etc.) you will need to do your processing in the module yaml file (/etc/filebeat/modules.d/[name of module].yml) and comment out any reference to the log in the filebeat.yml (see above regarding errors on citing the same log file in different ymls).
Inside the module yml you would create an entry in this way:
- module: tomcat
  # All logs
  log:
    enabled: true

    # Set which input to use between syslog (default) or file.
    var.input: "file"

    # Set custom paths for the log files. If left empty,
    # Filebeat will choose the paths depending on your OS.
    var.paths: ["/var/log/tomcat.log"]

    input:
      processors:
        - dissect:
            # example below:
            tokenizer: %{date} %{warning} %{banned_ip}
I bolded “input:” above, as it’s required if you do your processing within a module.
Filebeat YML
If a module is not used, then the processing can be done inside the filebeat.yml file (/etc/filebeat/filebeat.yml).
The syntax is slightly different. You can place your processor after the log path section near the top of the filebeat.yml file.
  processors:
    - dissect:
        tokenizer: '%{month} %{day} %{http}
        field: "message"
As the file opens with a reference to filebeat.inputs: the subsequent processor stanza doesn’t require an input value.
Errors with YML Files
NOTE: Keep in mind if you have installed a module, you’ll need to add the processing or tokenization to your module’s yaml and not the main filebeat.yml file. The reason for this is that you can not have multiple yml files pointing to the same log file – it may work in a test environment but once you get lots of traffic there will be issues on which yml is able to access the file.
ELK Consumption of Events
Once you have your YML files updated, a test can be done to make sure the YML files are formatted correctly:
sudo filebeat setup -esetup -e is an interactive setup with debug output. If an error presents itself, it will be mentioned here. Sadly Filebeat does not differentiate between the yml files used, so if an error is in a module yml file it will not be specific. Instead a generic message regarding an error at line # in the yml file. Not quite useful enough to debug if multiple modules and yml files are being used.
If setup runs without error, try restarting/starting filebeat:
sudo systemctl restart filebeatIf the ELK server has been configured correctly, and there are no errors on Filebeat’s end, events should be showing up in ELK.
Using Discover in Kibana
A quick way to determine if the events are being parsed correctly, is to click the hamburger menu in the upper left of the ELK UI. Clicking on “Discover” will open up a window showing all events being consumed in ELK.
If there are multiple sources feeding data into this ELK server, it can be too much diagnose the issue at hand. I often use the filter to isolate the server that I’m working with. This can be done by clicking “Filter +” at the top of the Discover page. It will spawn a small modal with a couple fields. In the first field type: agent.name and in the second field (which is a dropdown) select “IS” and in the third field (which will now spawn), click and a set of values will load. Selecting the server of choice will now filter for only traffic of that source.
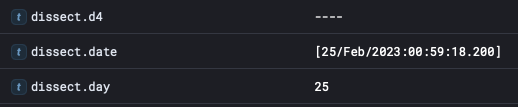
In the main section of the page, there’s events coming into ELK. Opening one of these recent ones (may have to hit refresh), will show all the details captured. If the tokenized values are working correctly, they will show up inside under “dissect.”
If data is loading, your connection is solid. It may not be mapped correctly, but this can be resolved by reviewing the raw log file data and the tokenization being applied.
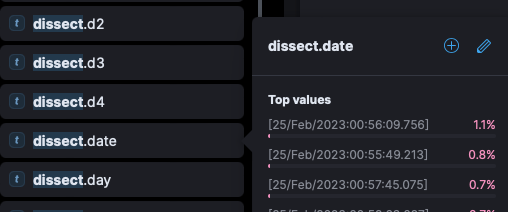
Using Dashboard Visualizations in Kibana
Another way to verify the data, is to create a new Dashboard visualization. On the left side panel, entering dissect in the search box will filter down to specific data elements in the event. Again, the dissect data is appearing for me. Clicking on the field, will spawn a side menu with data values for that field: